
A Few Examples of Pictures (Using MATLAB or c++):
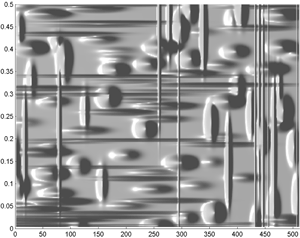
Fig.61 Same as before with relief.
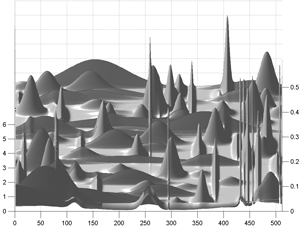
Fig.62 Same as before with relief and elevation (and azimut 0°).
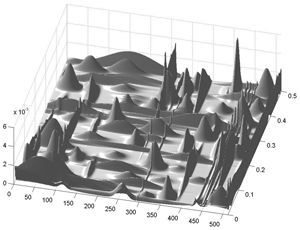
Fig.63 Same as before with relief, elevation and azimut.
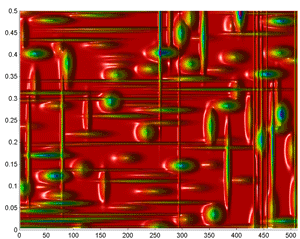
Fig.64 Wigner Distribution of Matching Pursuit waveform atoms in the Time-Frequency plane for the logistic map in the chaotic domain (512 data).
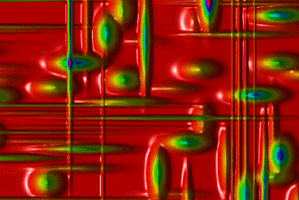
Fig.65 Detail of the previous picture (colormap HSV).
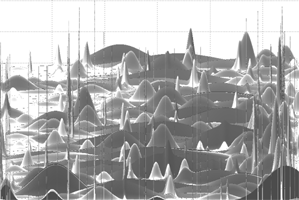
Fig.67 Energy Distribution of Matching Pursuit Time-Frequency atoms in the Phase Space for eleven years of a stock-index (elevation 35°, azimut 0°).
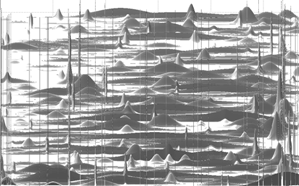
Fig.68 Wigner Distribution of Matching Pursuit Time-Frequency atoms in the Phase Space for eleven years of a stock-index (elevation 75°, azimut 0°).
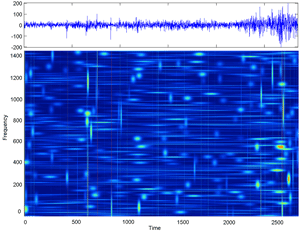
Fig.66 Wigner Distribution of Matching Pursuit Time-Frequency atoms in the phase plane for eleven years of a stock-index.
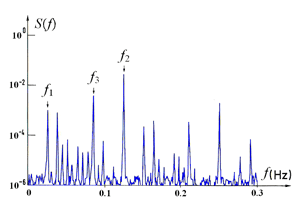
Fig.69 Spectrum of a quasiperiodic signal for three immeasurable frequencies observed in the R-B instability, Ra/Rac=42,3 (the spectral scale is logarithmic). Before this value, several (Hopf) bifurcations occurred for lower values of Ra/Rac. (ref. to J.Gollub & S.Benson).